Note
Go to the end to download the full example code.
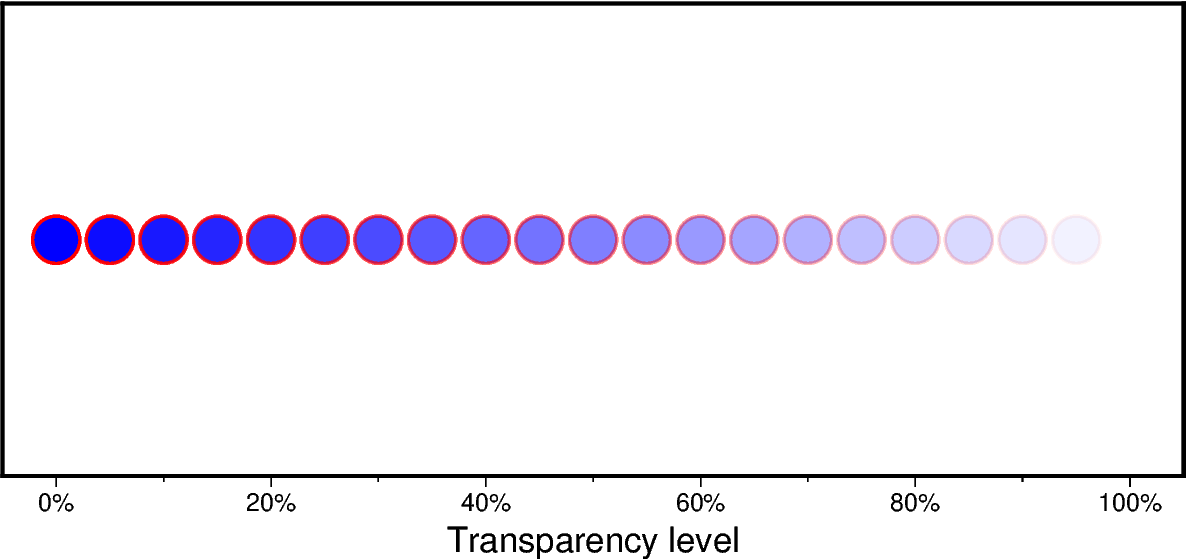
Points with varying transparency
Points can be plotted with different transparency levels by passing in an array
argument to the transparency parameter of pygmt.Figure.plot.
import numpy as np
import pygmt
from pygmt.params import Axis, Frame

# prepare the input x and y data
x = np.arange(0, 105, 5)
y = np.ones(x.size)
# transparency level in percentage from 0 (i.e., opaque) to 100
transparency = x

fig = pygmt.Figure()
fig.basemap(
    region=[-5, 105, 0, 2],
    frame=Frame(
        axes="WSrt",
        xaxis=Axis(annot=True, tick=True, label="Transparency level", unit="%"),
    ),
    projection="X15c/6c",
)
fig.plot(x=x, y=y, style="c0.6c", fill="blue", pen="1p,red", transparency=transparency)
fig.show()
Total running time of the script: (0 minutes 0.168 seconds)